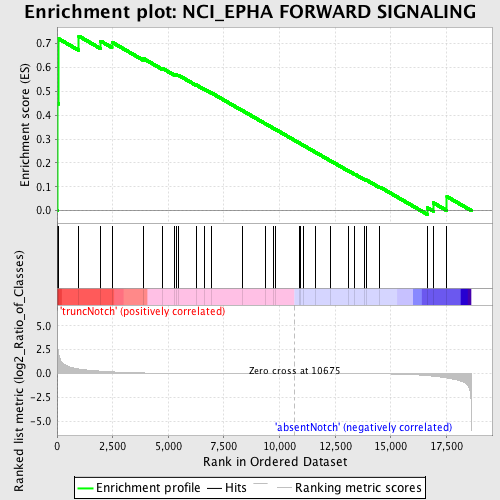
Profile of the Running ES Score & Positions of GeneSet Members on the Rank Ordered List
| Dataset | Set_03_absentNotch_versus_truncNotch.phenotype_absentNotch_versus_truncNotch.cls #truncNotch_versus_absentNotch |
| Phenotype | phenotype_absentNotch_versus_truncNotch.cls#truncNotch_versus_absentNotch |
| Upregulated in class | truncNotch |
| GeneSet | NCI_EPHA FORWARD SIGNALING |
| Enrichment Score (ES) | 0.7313493 |
| Normalized Enrichment Score (NES) | 1.4796827 |
| Nominal p-value | 0.016 |
| FDR q-value | 0.44124362 |
| FWER p-Value | 1.0 |
| PROBE | DESCRIPTION (from dataset) | GENE SYMBOL | GENE_TITLE | RANK IN GENE LIST | RANK METRIC SCORE | RUNNING ES | CORE ENRICHMENT | |
|---|---|---|---|---|---|---|---|---|
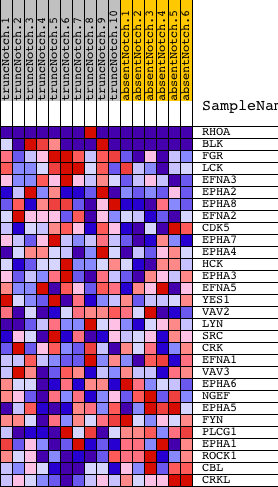
| 1 | RHOA | 580142 5900131 5340450 | 18 | 3.530 | 0.4489 | Yes | ||
| 2 | BLK | 1940128 5390053 | 63 | 2.150 | 0.7206 | Yes | ||
| 3 | FGR | 3780047 | 977 | 0.470 | 0.7313 | Yes | ||
| 4 | LCK | 3360142 | 1955 | 0.250 | 0.7106 | No | ||
| 5 | EFNA3 | 6370390 | 2468 | 0.178 | 0.7058 | No | ||
| 6 | EPHA2 | 5890056 | 3888 | 0.060 | 0.6371 | No | ||
| 7 | EPHA8 | 6520242 | 4734 | 0.037 | 0.5963 | No | ||
| 8 | EFNA2 | 460193 | 5294 | 0.027 | 0.5696 | No | ||
| 9 | CDK5 | 940348 | 5356 | 0.026 | 0.5696 | No | ||
| 10 | EPHA7 | 1190288 4010278 | 5441 | 0.025 | 0.5683 | No | ||
| 11 | EPHA4 | 460750 | 6242 | 0.017 | 0.5274 | No | ||
| 12 | HCK | 4230592 | 6640 | 0.014 | 0.5078 | No | ||
| 13 | EPHA3 | 2190497 5080059 | 6923 | 0.012 | 0.4942 | No | ||
| 14 | EFNA5 | 460707 2190519 | 8328 | 0.006 | 0.4194 | No | ||
| 15 | YES1 | 6100050 | 9348 | 0.003 | 0.3650 | No | ||
| 16 | VAV2 | 3610725 5890717 | 9722 | 0.002 | 0.3453 | No | ||
| 17 | LYN | 6040600 | 9805 | 0.002 | 0.3411 | No | ||
| 18 | SRC | 580132 | 10877 | -0.001 | 0.2836 | No | ||
| 19 | CRK | 1230162 4780128 | 10920 | -0.001 | 0.2814 | No | ||
| 20 | EFNA1 | 3840672 | 11079 | -0.001 | 0.2730 | No | ||
| 21 | VAV3 | 1050731 2450242 2680653 | 11604 | -0.002 | 0.2451 | No | ||
| 22 | EPHA6 | 3520037 | 12305 | -0.005 | 0.2081 | No | ||
| 23 | NGEF | 3190538 | 13107 | -0.008 | 0.1660 | No | ||
| 24 | EPHA5 | 2340671 | 13375 | -0.010 | 0.1529 | No | ||
| 25 | FYN | 2100468 4760520 4850687 | 13795 | -0.014 | 0.1321 | No | ||
| 26 | PLCG1 | 6020369 | 13898 | -0.015 | 0.1285 | No | ||
| 27 | EPHA1 | 4590021 5670139 6660100 | 14509 | -0.025 | 0.0989 | No | ||
| 28 | ROCK1 | 130044 | 16649 | -0.218 | 0.0116 | No | ||
| 29 | CBL | 6380068 | 16908 | -0.276 | 0.0330 | No | ||
| 30 | CRKL | 4050427 | 17522 | -0.462 | 0.0589 | No |